


Domain : Sales & Marketing
Function :
Performed India based hardware company sales insights
Project Overview:
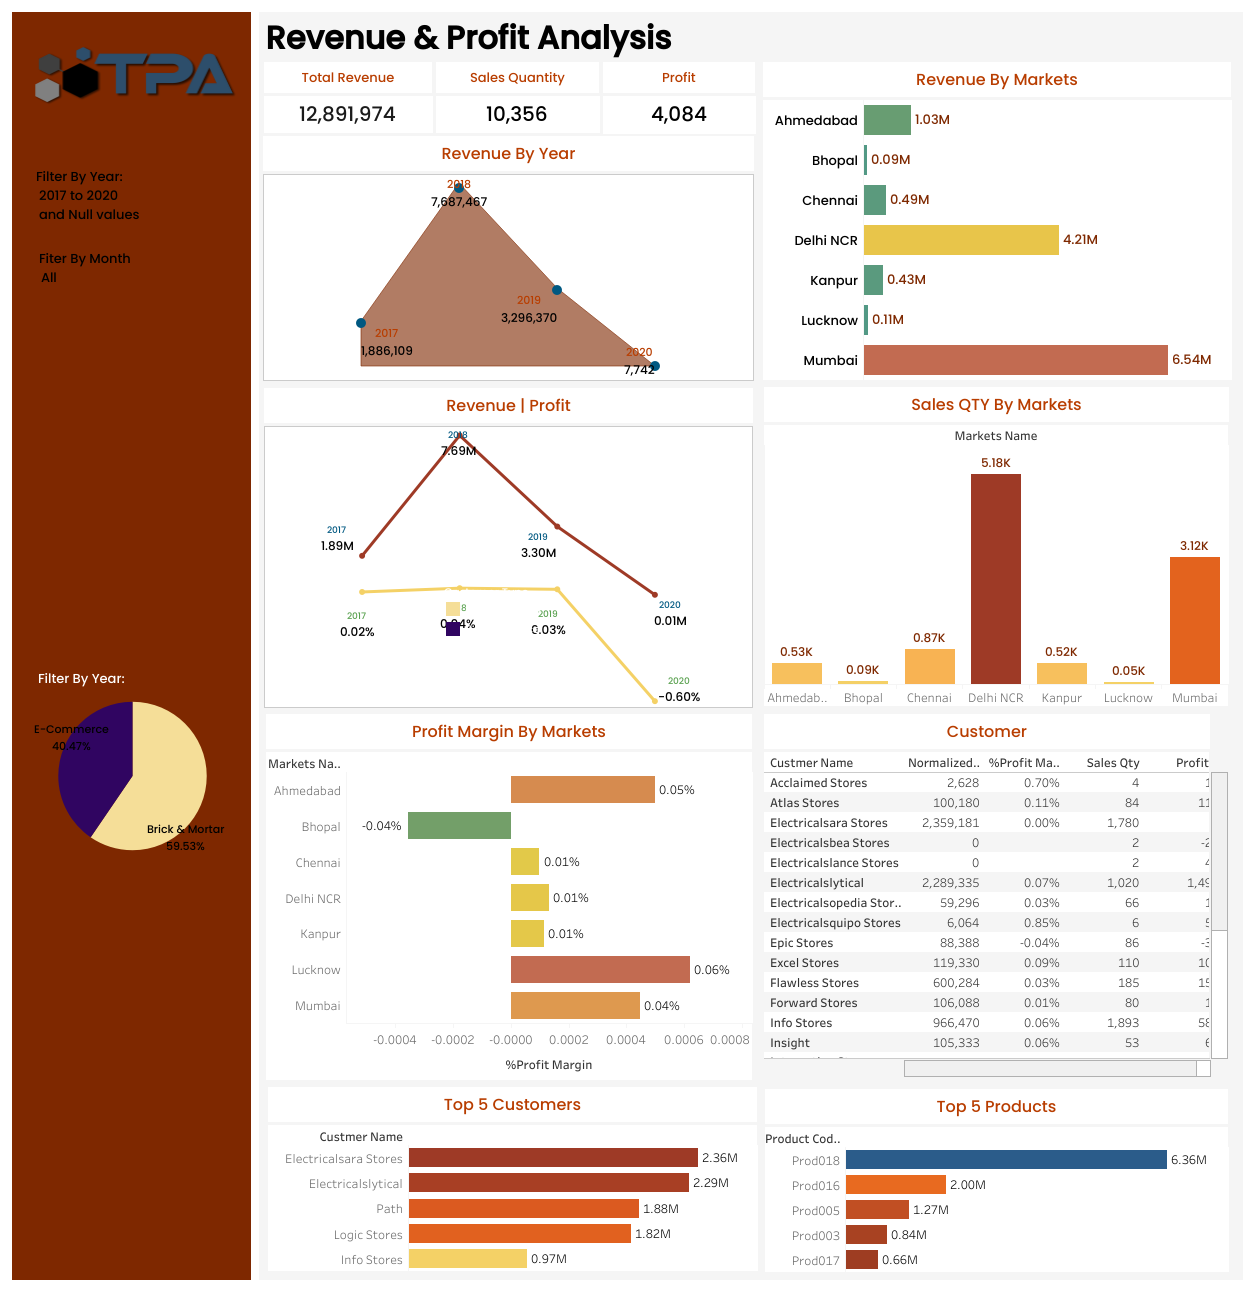
Developed a Tableau dashboard to perform analysis, producing quantitative visualizations in Tableau to draw valuable insights based on different parameters affecting the company performance year on year and further provide business solutions.
Problem Statements:
Sales director wants to know the performance of the company in various Indian states & accordingly provide some discount.
Click to view Requests
- Revenue breakdown by cities.
- Revenue brekdown by years & months.
- Top 5 customers by revenue & sales quantity.
- Top 5 Products by revenue.
- Net Profit & Profit Margin by Market
Methodology:
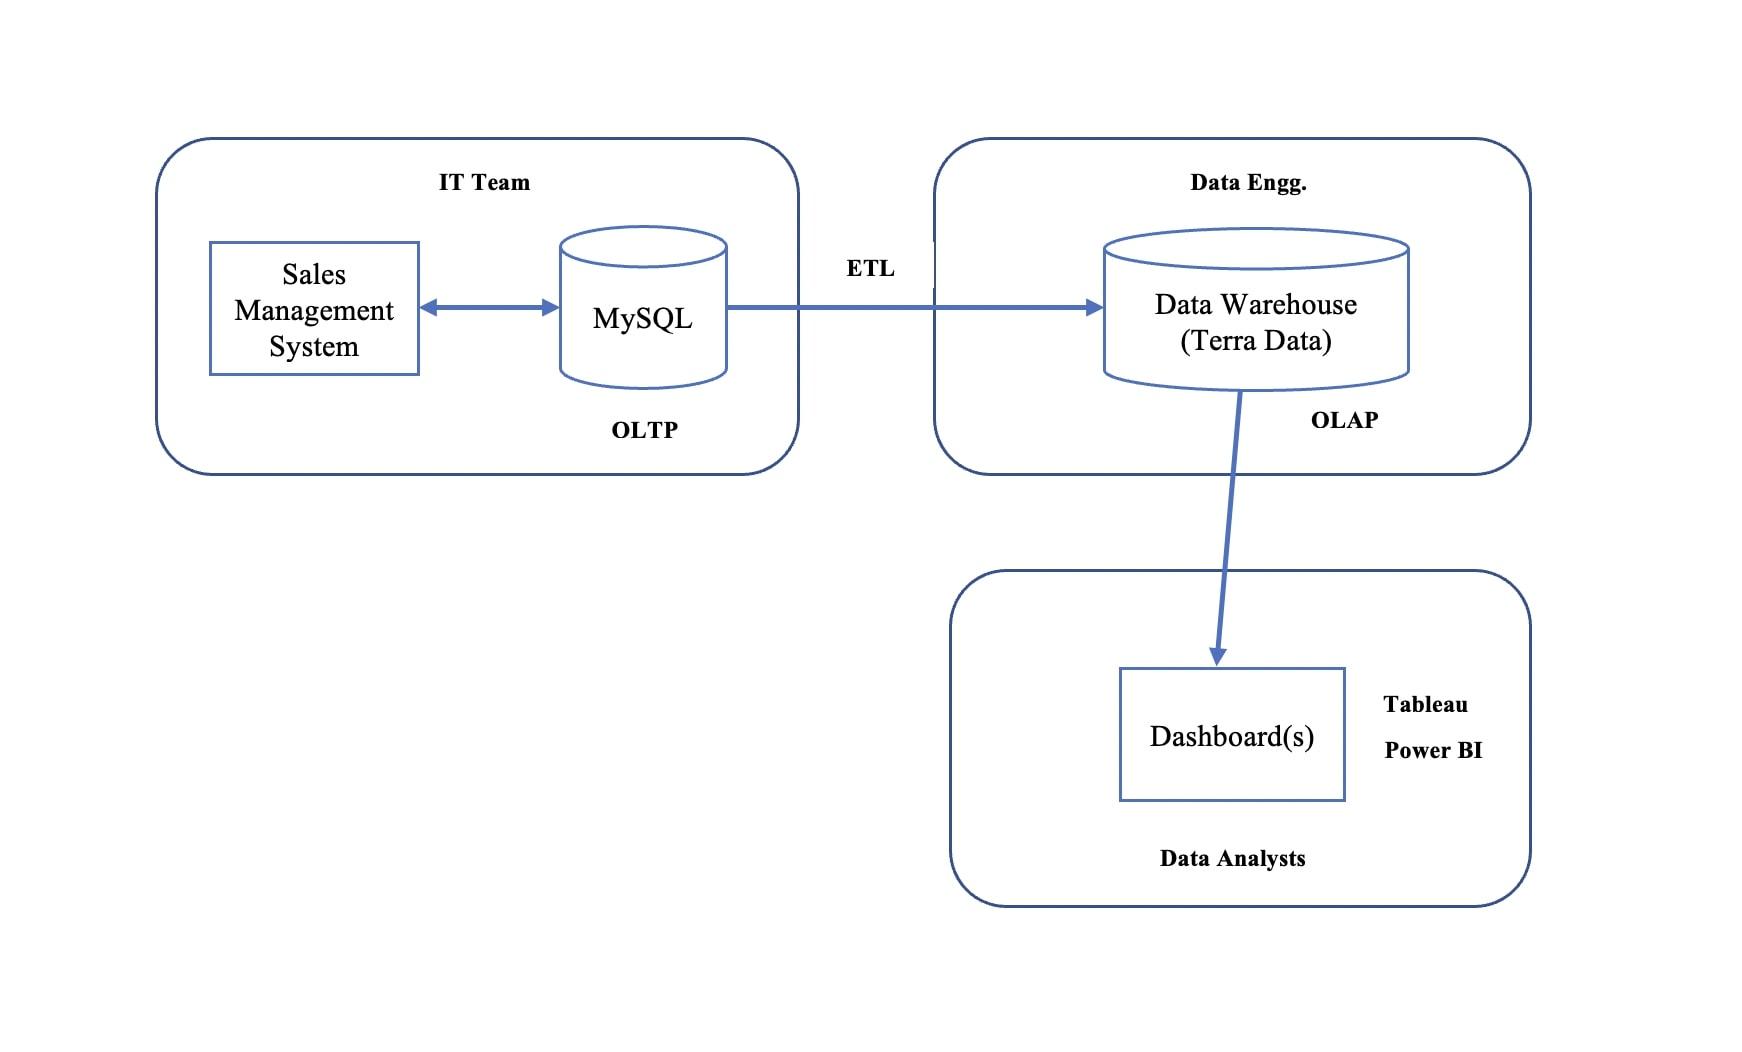
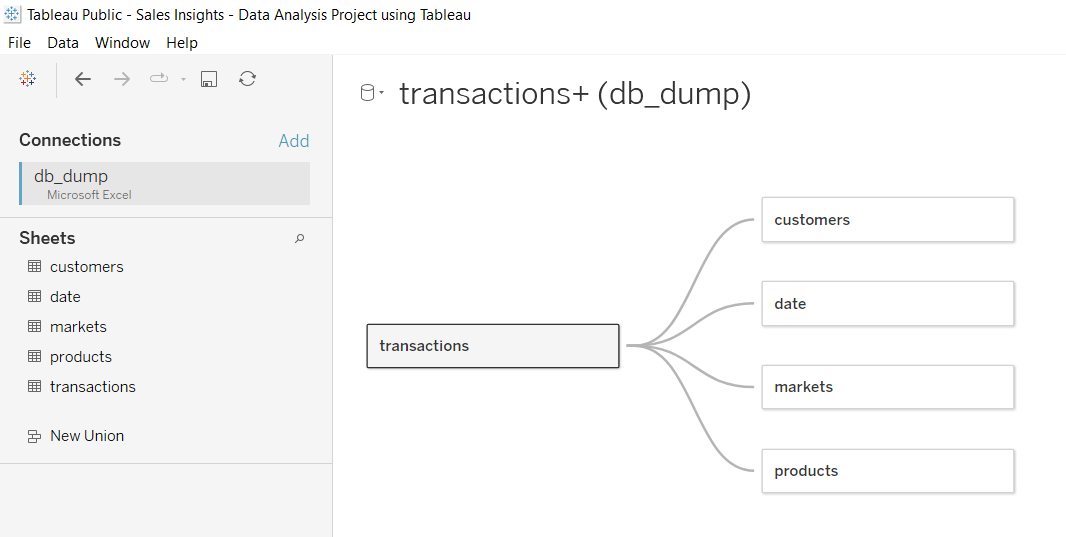
Developed ETL mappings using SQL to extract the data from unstructured data and transformed it to the staging area to conduct data cleaning and design star schema data model on Tableau. Developed a Tableau dashboard to perform analysis, producing quantitative visualizations in Tableau to draw valuable insights based on different parameters affecting the company performance year on year and further provide business solutions.
Success Criteria:
Developed ETL mappings using SQL to extract the data from unstructured data and transformed it to the staging area to conduct data cleaning and design star schema data model on Tableau. Developed a Tableau dashboard to perform analysis, producing quantitative visualizations in Tableau to draw valuable insights based on different parameters affecting the company performance year on year and further provide business solutions.
Dashboard Snippet
 Tableau