


Domain : Finanace and Accounting
Function :
Analysis and Visualization of Financial Incomes
Problem Statement:
The project aims to analyze and visualize financial incomes for a company to identify trends, income sources, and potential marketing strategies. The goal is to provide insights to the company to improve its revenue streams and increase profitability.
Project Overview:
The project involves analyzing financial incomes using SQL and visualizing the results using PowerBI and Tableau. The project focuses on analyzing total income, target income, total income by target income and percentage difference, income sources analysis, marketing strategies, QTY, income by country, and average monthly income. The project will provide insights into the financial performance of the company and help in identifying areas for improvement.
Methodology:
The project uses SQL to extract data from the financial database and transform the data to create tables and views that are used for analysis. PowerBI and Tableau are used for visualization, and interactive dashboards are created to present the results. The project involves data cleaning, data transformation, data aggregation, and data visualization techniques.
Success Criteria:
The success of the project will be evaluated based on the following criteria:
Dashboard Snippet
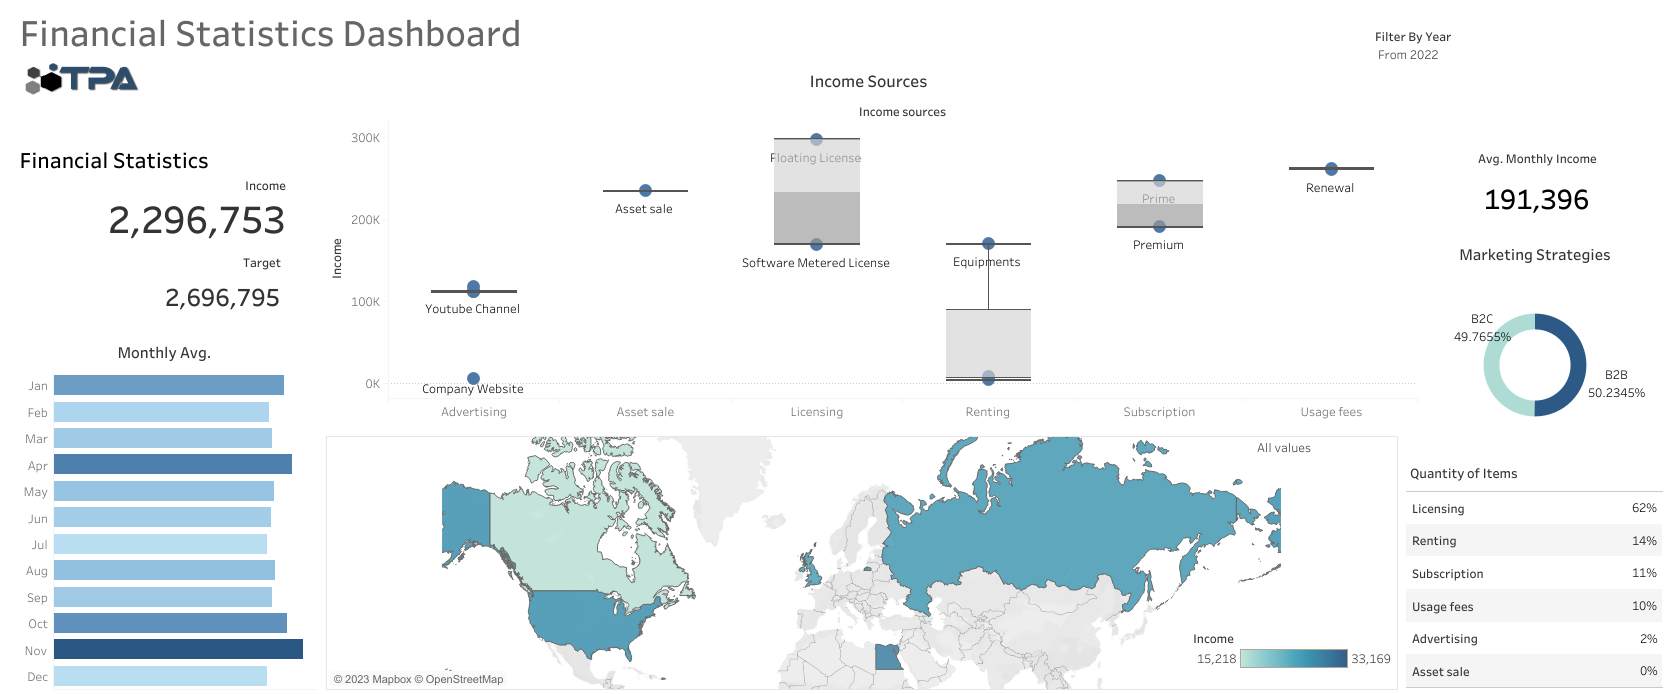 Tableau
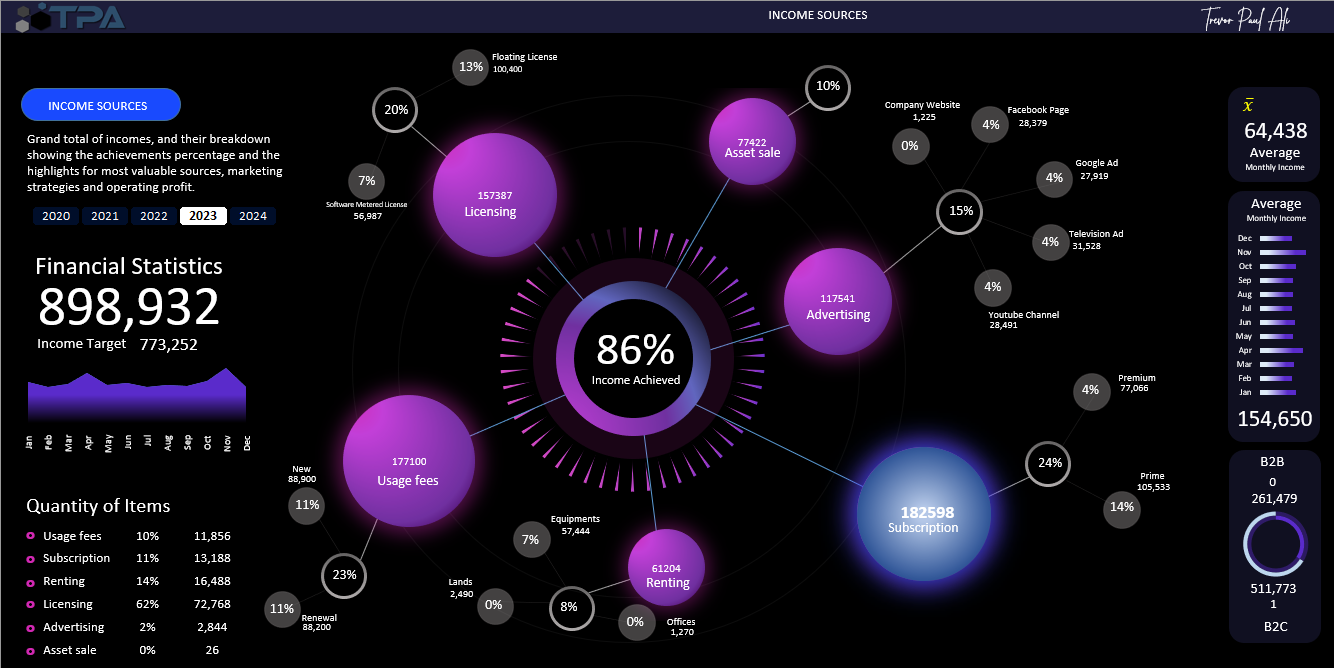 Excel
Excel PowerBI