

Domain: Sales and Retail
Function: Sales Analysis
Problem Statement
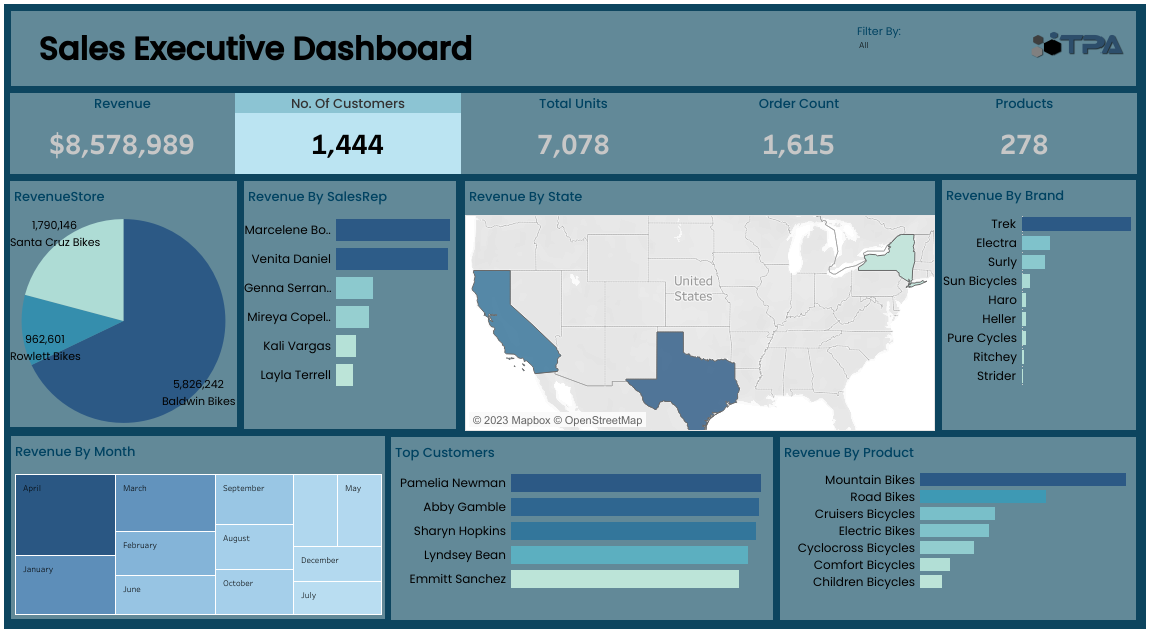
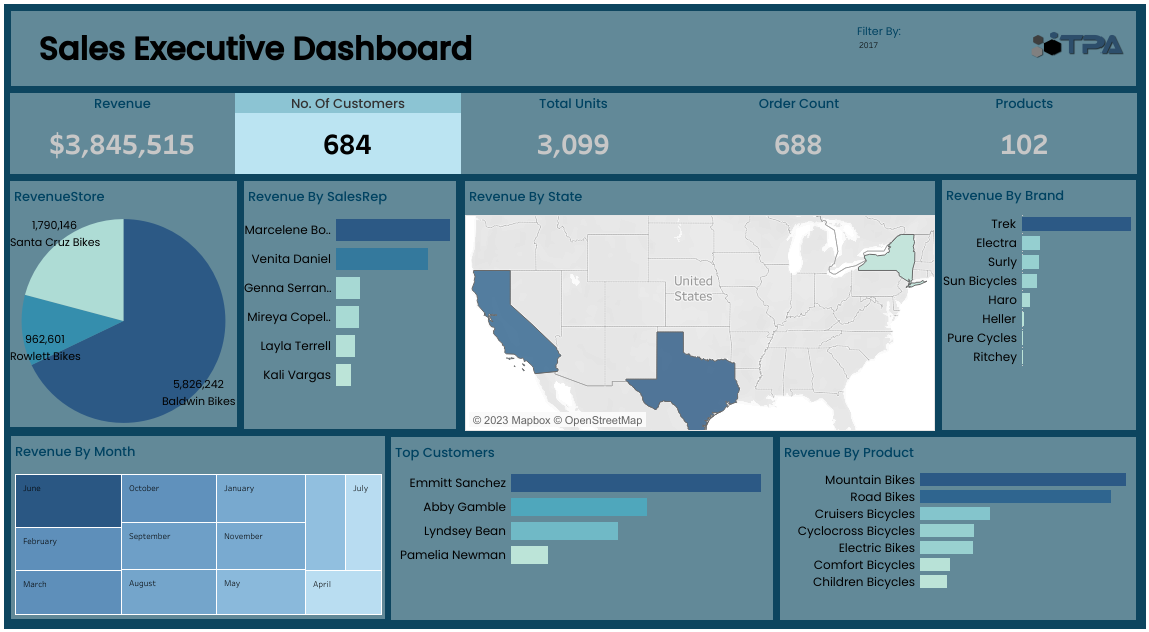
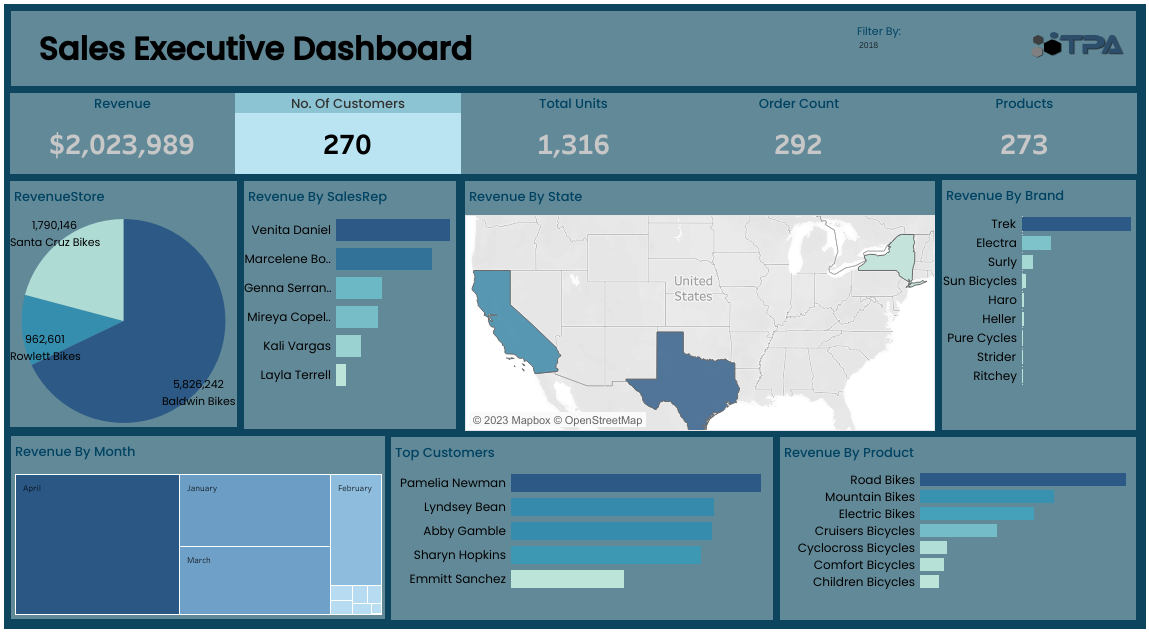
A bike store wants to analyze their sales data to identify trends and insights that will help them improve their business operations. They have data on their customers, orders, products, and sales staff. They want to identify patterns in their sales data, such as revenue per month, revenue per state, revenue per brand, revenue per product, revenue per salesrep, and top 10 customers.
Objective:
The objective of this project is to analyze the bike store's sales data and provide insights that will help them improve their business operations. The project will extract data from the bike store's database and perform analysis to identify patterns and trends in their sales data. The insights gained will help the bike store make informed decisions about their business operations, such as which products to stock, which sales reps are performing well, and which customers are most valuable.
Methodology :
To extract the data needed for analysis, SQL was used to join several tables from
the bike store's database, including the orders, customers, order_items, products,
categories, stores, staffs, and brands tables. The SQL code used to extract the
data is shown above.
The data was cleaned, preprocessed, and visualized to identify patterns and trends
in the data. The insights gained from the analysis were then presented in a clear and
concise manner using visualizations and summaries
Screenshots